Private home prices rise 0.7% in 4Q2025, full-year growth slows to 3.4%: URA flash

Flash estimates released by URA show that the overall private residential property price index rose 0.7% q-o-q in 4Q2025
Ask Buddy
Private home prices in Singapore extended their gains in 4Q2025, albeit at a slower pace, amid lower transaction volumes and heightened buyer price sensitivity.
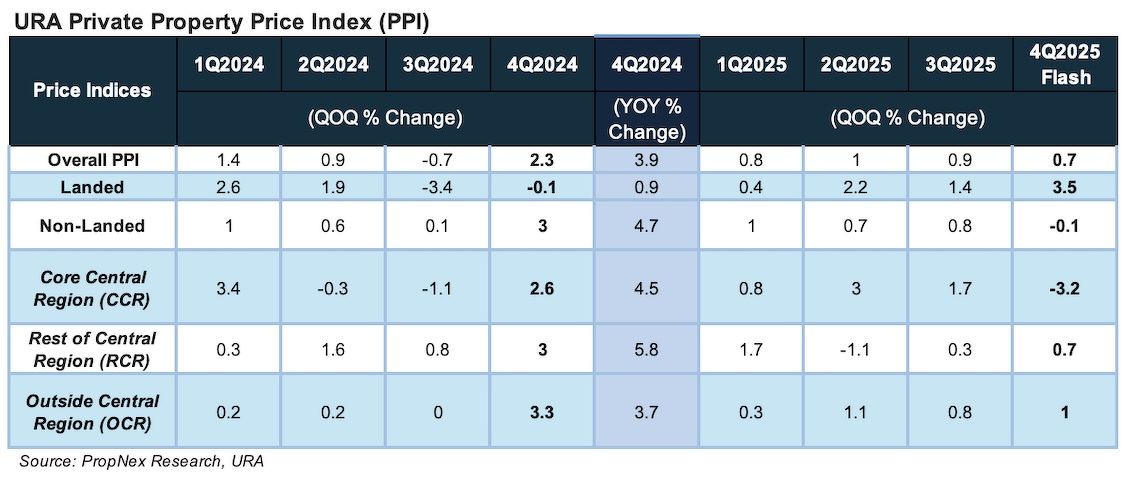
Flash estimates released by the Urban Redevelopment Authority (URA) show that the overall private residential property price index rose 0.7% q-o-q in the quarter, easing from 0.9% growth in 3Q2025.
For the full year, private home prices climbed 3.4%, slower than the 3.9% growth in 2024 and well below the gains of 6.8% in 2023 and 8.6% in 2022, says Christine Sun, chief researcher and strategist at Realion Group (OrangeTee & ETC).
Search for the latest New Launches, to find out the transaction prices and available units
“This is also the slowest annual price growth since 2020, when prices rose 2.2% during the COVID-19 pandemic,” she adds.
Leonard Tay, head of research at Knight Frank Singapore, attributes the moderation in 2025 to “greater sensitivity on the part of developers to buyers’ price concerns," which in turn reined in price growth, despite a boost to sales activity from easing interest rates through much of the year.
Non-landed prices dip overall, but suburban market outperforms
Prices of non-landed private homes — condominiums and apartments — dipped marginally by 0.1% in 4Q2025, reversing the 0.8% increase in the previous quarter.
Among the sub-markets, the Outside Central Region (OCR) led price growth, with non-landed prices rising 1% quarter-on-quarter, up from 0.8% in 3Q2025. This was followed by the Rest of Central Region (RCR), where prices increased 0.7%, compared with 0.3% in the prior quarter.
In contrast, prices in the Core Central Region (CCR) fell 3.2% in 4Q2025, reversing the 1.7% growth recorded in 3Q2025.
CCR prices fall on ‘mix of new sale transactions’
Wong Xian Yang, head of research for Singapore and Southeast Asia at Cushman & Wakefield, attributes the decline in CCR prices partly to changes in the mix of new sale transactions.
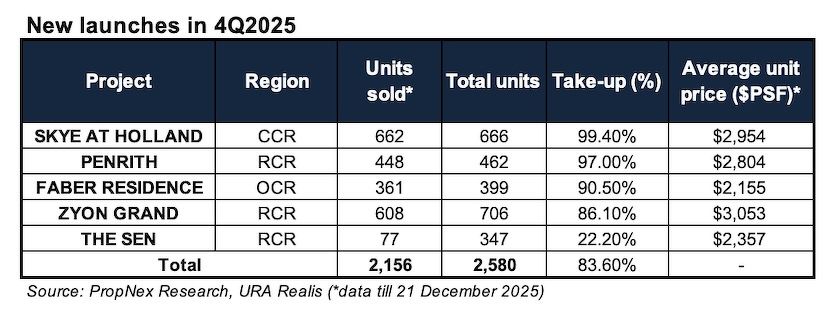
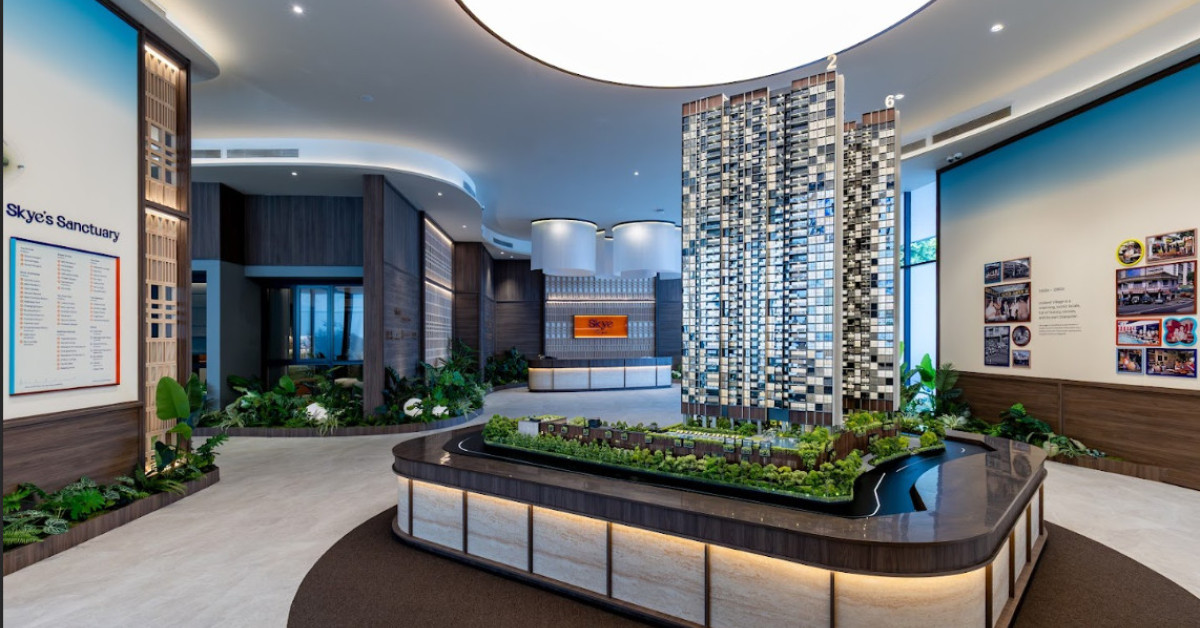
CCR activity in 4Q2025 was dominated by the launch of the 666-unit Skye at Holland in District 10, which sold 662 units during the quarter at a median price of $2,948 psf, based on caveat data. Sales at Skye at Holland accounted for about 51% of total CCR non-landed transactions in the quarter.
By comparison, 3Q2025 saw higher-priced launches such as River Green in District 9 and UpperHouse at Orchard Boulevard in District 10. River Green sold 465 units at a median price of $3,111 psf, while UpperHouse moved 202 units at $3,277 psf. Together, the two projects made up 43% of CCR new home sales in 3Q2025, notes Wong.
This suggests that shifts in launch profiles — rather than broad-based price weakness — shaped overall price movements in 4Q2025.
New launches drive overall price growth
The overall price increase in 4Q2025 was driven mainly by a higher proportion of new home sales, says Realion’s Sun.
Based on URA Realis data, new home sales (excluding executive condominiums) rose from 44.3% of total transactions in 3Q2025 to 48% in 4Q2025.
Several large projects transacted at median prices above $2,500 psf. Besides Skye at Holland in the CCR, strong sales were recorded in the RCR, where Zyon Grand sold 608 units at a median price of $3,039 psf, Penrith moved 448 units at $2,793 psf, and The Continuum sold 60 units at $2,551 psf.
Overall, 3,389 private homes — or 56.6% of the 5,989 transactions recorded in 4Q2025 — were sold at prices of at least $2 million. This compares with 47.1% of transactions in the same price range in 3Q2025, notes Sun.
Landed homes lead price growth in 2025
The landed housing segment was the strongest contributor to price growth in 2025.
Landed home prices jumped 3.5% quarter-on-quarter in 4Q2025, accelerating from a 1.4% increase in 3Q2025. This marked the strongest quarterly growth in two years, notes PropNex.
Despite fewer transactions — 491 landed deals in 4Q2025 compared with 559 in the previous quarter — landed prices rose 7.7% cumulatively in 2025, far exceeding the 0.9% increase recorded in 2024.
“Lower interest rates likely boosted sentiment,” says Kelvin Fong, CEO of PropNex, adding that affordability improvements encouraged both buyers and sellers to transact.
New home sales hit four-year high
Developers sold an estimated 2,882 new private homes (excluding ECs) in 4Q2025, bringing full-year sales to 10,757 units, based on caveats lodged as at Dec 21, 2025. This is 66.3% higher than the 6,469 units sold in 2024.
The RCR led new home sales in 2025 with 4,448 units, followed by the OCR with 4,404 units and the CCR with 1,905 units. All three sub-markets posted four-year highs, with the previous peak recorded in 2021.
In the resale market, an estimated 2,954 units changed hands in 4Q2025, taking total resale volume to 14,047 units for the year — comparable to the 14,053 units transacted in 2024.
Notably, CCR resale transactions reached 2,592 units in 2025, the highest level in four years, says PropNex’s Fong, supported by renewed interest in prime districts following strong new launch activity.
Developers sold 73 new executive condominium units in 4Q2025, lifting full-year EC sales to an estimated 1,623 units — a four-year high since 2021. EC sales momentum is expected to pick up in 1Q2026 with the launch of Coastal Cabana and Rivelle Tampines.
Rising land costs, knock-on impact on future launch prices
The Government Land Sales (GLS) programme will provide a healthy supply of about 9,185 potential private homes in 1H2026. Knight Frank’s Tay notes increasing competition and higher land rates in recent tenders.
“While the GLS tenders earlier in 2025 were often measured and land rates were within expectations, the last few tenders in 2H2025 appear to reflect a greater urgency and a stronger willingness to push land pricing boundaries on the part of developers,” says Tay.
He sees the brisk take-up of more than 10,000 new sales in 2025 spurring developers to ratchet up efforts to dedicate more financial resources in acquiring land. “The increasing land prices will inevitably have a knock-on impact on selling prices at launch some 12 to 15 months later,” Tay cautions.
Sales to ease in 2026, prices to rise moderately
Looking ahead, analysts expect buying sentiment to remain resilient in 2026, supported by low interest rates, although sales volumes may moderate amid fewer new launches and the normalisation of pent-up demand.
CBRE forecasts 7,500 to 8,500 new home sales in 2026, with private home prices rising 2% to 4%. C&W’s Wong likewise expects private home prices to grow by 2% to 4% in 2026.
Knight Frank projects price growth of 3% to 5%, while PropNex expects 3% to 4%. Realion, meanwhile, projects private home prices to increase by 2.5% to 4.5% for the whole of 2026.
ERA Singapore CEO Marcus Chu expects new home sales of 9,000 to 10,000 units, while Huttons Asia anticipates developers’ sales of 8,000 to 10,000 units, with OCR launches accounting for nearly 60% of new supply.
“While sales volumes may ease from 2025’s peak, overall market conditions remain healthy,” says Realion’s Sun. “Total private home transactions in 2026 are expected to stay above the 10-year average, underscoring the market’s resilience.”
Check out the latest listings for Skye At Holland, Penrith, Zyon Grand, The Sen, Faber Residence properties
Ask Buddy
Follow Us
Property updates, 24/7.


Subscribe to Newsletter
Market insights, delivered weekly.
Top Articles
Search