
Size is not the only measure for quality: Decoding Conquas bands for private homes

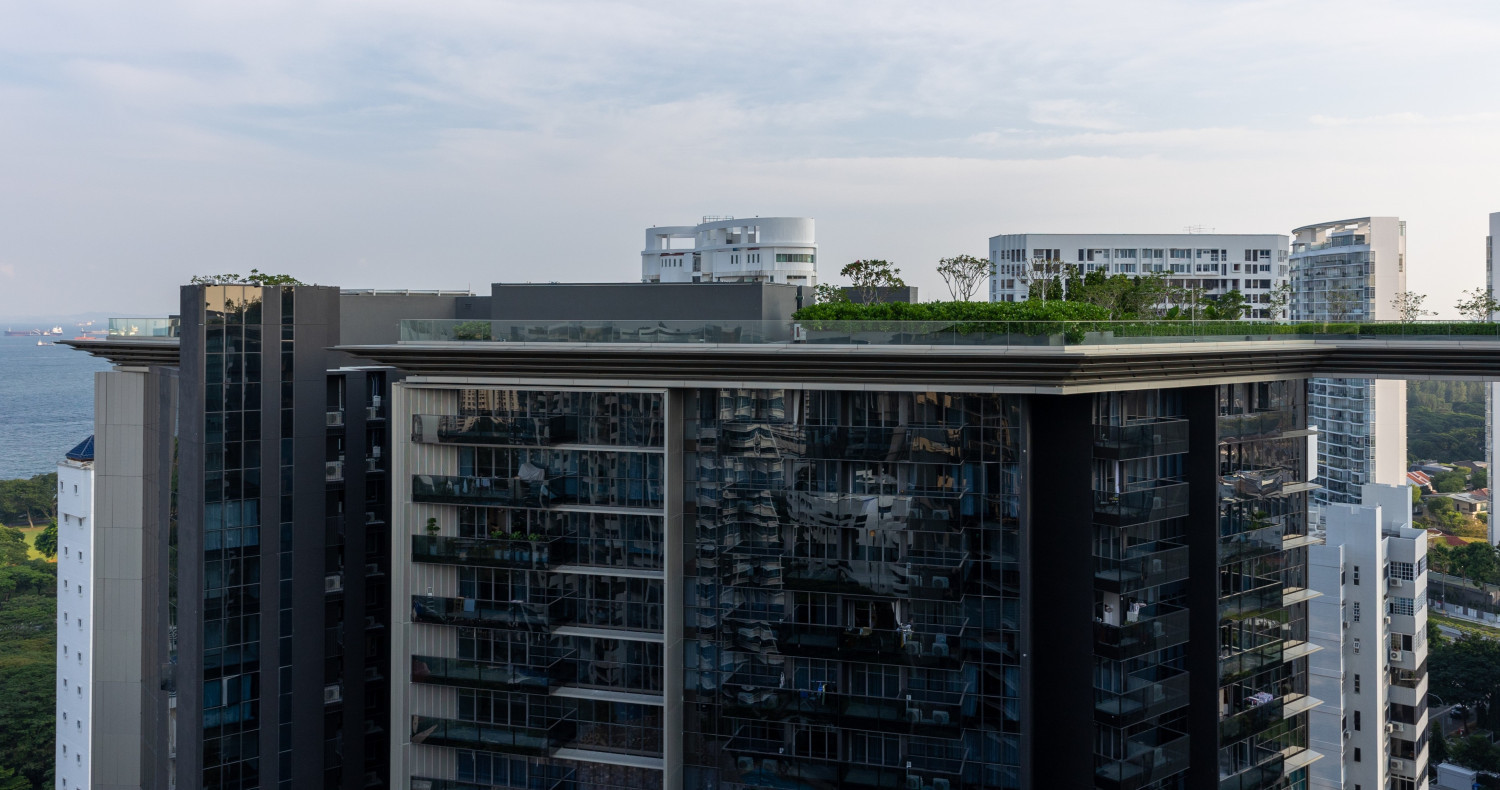
Amber Park, a Conquas Band 1 project. (Photo: Samuel Isaac Chua/EdgeProp Singapore)

Ask Buddy
EdgeProp analysis of data from the Building and Construction Authority (BCA) over the past six years shows a pattern worth noting: boutique developments of fewer than 50 units account for close to 60% of assessed private residential projects that fell into Bands 4 to 6, the lower half of the workmanship scale.
Those bands come from BCA’s Construction Quality Assessment System (Conquas), which assesses construction workmanship on completion and sorts projects into six bands, with Band 1 the highest. While smaller builds are over-represented in the lower Conquas bands, project size alone does not tell the full picture.
Project size alone is a weak guide to build quality
Analysis of BCA data for the past six years returns an R² of 0.31 between project size and Conquas outcomes, meaning size accounts for roughly a third of the variation in band results. Developments above 300 units averaged Band 1.8 against 3.77 for projects under 50 units. Median project size falls in step with the bands, from 429 units in Band 1 to 16 units in Band 5. Meanwhile, 83% of projects with 300 or more units achieved Band 1 or 2, compared with 21% of those under 50 units (see Table 1).
Those averages conceal a wide spread. Boutique projects span the full range from Band 1 to Band 6. Eden (20 units) and Baywind Residences (24 units) each achieved Band 1, while Lavender Residence (17 units) and Mooi Residences (24 units) were the only two Band 6 projects in the six-year record. In the other direction, Pullman Residences Newton (340 units) was rated at Band 5 and Affinity at Serangoon (1,052 units) rated Band 4.
The builder’s band is the stronger signal
Compared to development size, the builder’s band tracks project bands far more closely. Across all builder bands, more than 90% of their projects stayed within a single band (see Table 2).
Builder bands accounted for about 78% of the variation in project bands. Overall, seven in 10 projects landed in exactly the same band as their builder, and 95% within one band. This trend is even more pronounced within boutique projects, where 84% of projects were in the same band as their builder, and every project fell within a single band of their builder’s band.
Individual portfolios show the same consistency. All five projects completed by a Band 1 builder were assessed at Band 1, from the 20-unit Eden to the 592-unit Amber Park. One Band 5 builder delivered Band 4 at Tedge (42 units), and Band 5 at the 140-unit RV Altitude.
Developer track record matters, but again, it is not the whole picture
The developer band is a reliable guide at both extremes. Every project from a Band 1 developer was rated at Band 1 or 2, and all from Band 5 developers were assessed at Band 5.
The linkage is less clear for mid-tier developers. Band 3 developers show the widest spread, with 28% of their projects at Band 1 or 2, 44% at Band 3 and 28% at Band 4. A potential explanation for this may lie in the builder hired. Across the ten developers using two or more builders on three or more projects, the builder's band tracks the outcome closely.
One Band 4 developer illustrates the point. The nine projects it developed alone were built by seven different builders, with results from Band 1 to Band 5. Its Band 2 builders delivered The Addition (26 units) at Band 1, and Mayfair Gardens (215 units) and Mayfair Modern (171 units) at Band 2. Where it engaged Band 5 builders, Sea Pavillion Residences (24 units) and The Verandah Residences (170 units) both came in at Band 5.
What portfolio depth tells us at the boutique end
Builders on projects under 50 units averaged 1.7 assessed projects over the period, against 5.1 for those on developments of 300 units or more. 61% of boutique projects were built by a builder appearing only once in the sample, against 14% of large ones.
Where a builder has one project on record, its band and that project’s results are effectively the same number. This does not make a band wrong, but it is worth reading alongside any other information that is known about the builder.
Developers are different. Small-project developers averaged 2.2 assessed projects against 2.5 for large-project developers, and most have only one or two banded projects regardless of the scale they build at. Portfolio depth separates builders, not developers.
Ultimately, Conquas measures the work of a whole project team. The builder matters, but other factors including the specification, the site and the design also bear on the outcome.
Bands are drifting downward, market-wide
Mean project band declined from 2.18 in 2022 to 2.75 in 2025, and the share assessed at Band 1 or 2 fell from 64.7% to 52.7%. There are three factors that may have influenced this.
First, the manpower crunch. Ministry of Manpower (MOM) data shows the construction and real estate sector's workforce fell by roughly 52,000 in 2020 compared to 2019. Headcount has since recovered past pre-pandemic levels, but ManpowerGroup's February 2026 survey found 77% of Construction and Real Estate employers struggling to fill roles.
Second, composition. Boutique projects' share of annual completions rose from 9.1% in 2021 to 29.1% in 2025, and since they skew towards lower bands, a growing share pulls the average down on its own. Bands slipped among developments of 300 units or more as well, from an average of 1.14 in 2022 to 2.27 in 2025 (see Chart 1).
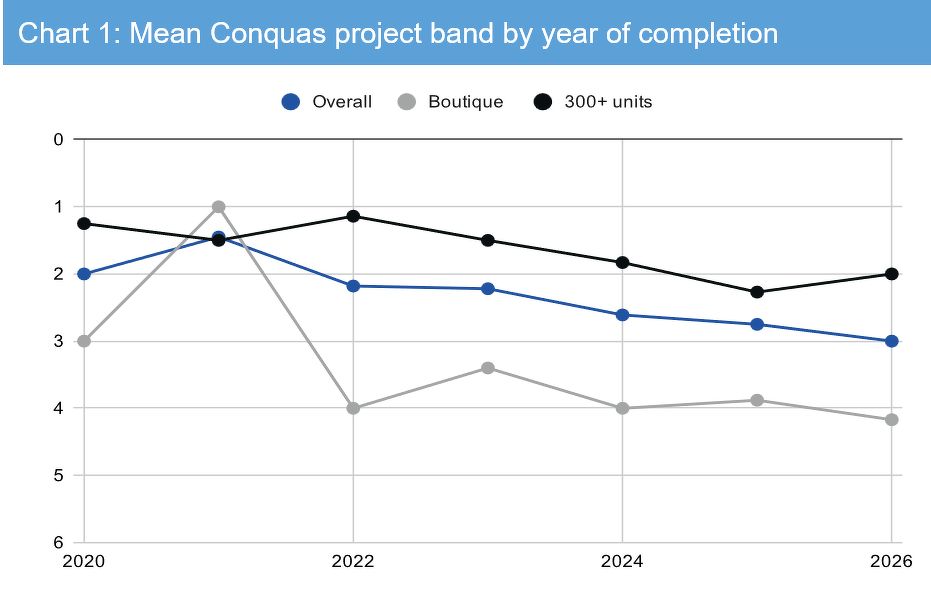
Source: BCA, EdgeProp research
Third, the assessment method changed. Conquas revised internal-finishes weightings from June 2022, and restructured the assessment into three components for tenders called from July 2023, so projects assessed early in the window were not scored on the same rubric as those assessed today.
What it means for buyers
Project size explains about a third of the variation in Conquas outcomes across the market. The builder's band tracks the project bands far more closely, accounting for roughly 78% of the variation across all projects and matching the outcome exactly in 84% of developments under 50 units. The developer's band holds at both extremes but weakens in the middle, where the choice of builder accounts for much of the spread. These are associations rather than causes, as the analysis does not control for budget, specification or site complexity, and a builder's band itself partly reflects the developers that hire it and the briefs they set.
For a boutique launch, buyers may want to consider the builder's band, the developer's record and the number of assessments behind each figure, alongside unit count.
Note: This analysis is based on EdgeProp Singapore's compilation of BCA Conquas band data for private residential projects assessed over the past six years, together with the developer and builder bands recorded for each project
Ask Buddy
Follow Us
Property updates, 24/7.


Subscribe to Newsletter
Market insights, delivered weekly.
Top Articles
Search